The design panel exposes some key functions that allow you to edit the design of your discovery. You can use these options to add data labels to charts, show totals in grids, change the color scheme of the discovery, and change the position of legends, slicers, and query captions.
Design Panel
General
Themes
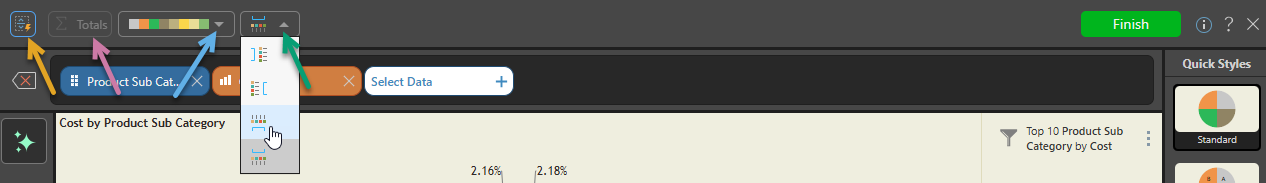
Change the color scheme used for the visual (blue arrow above).
Layout
Change the position of the discovery's slicers, legends, filters, and sorting (green arrow). For an example, see Layout and Captions (below).
Grids only
Totals
Show or hide totals in a Grid (purple arrow).
Charts only
Data Labels
Show or hide data labels in the visual (orange arrow above). The data labels display the value for each segment of the chart, according to the measure you added to the visual. This option is enabled when working with charts.
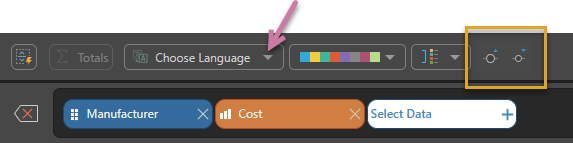
Data Point Size
Increase and decrease the size of data points on the visualization (orange highlight below). This option is only available for visualization types that include data points.
Choose Language
When working with MS OLAP or MS Tabular or SAP HANA and SAP BW data models, users can change the language used for metadata and queries. Changing the language using the Choose Language dropdown list affects visualizations and trees (dimensions, elements, and measures):
- Click here for more information about Languages
Layout and Captions
Use the Layout dropdown list (purple arrow below) to change the position of all slicers, legends, and Filter and Sort query captions on the discovery. These may be positioned to the right, left, top, or bottom of the canvas:
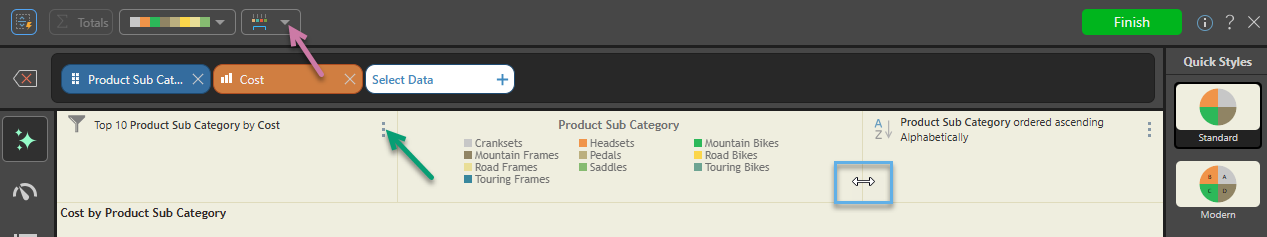
Once you have positioned your artifacts as a group using the Layout dropdown list, you can also edit them individually:
Reposition
You can reposition the captions using the grab handles (green arrow above). You can drag the captions to a different position at the top, bottom, left, or right side of the canvas. A blue highlight appears when you are over a "docking" zone, and you can drop the panel onto that zone to dock it.
Resize
You can resize the captions by dragging their borders (blue highlight) up, down, left, or right, depending on the panel's position.
Remove
You can remove the captions, where applicable, by clicking the vertical "ellipsis" (green arrow) and selecting Remove on the context menu. This removes the described Sort or Filter from the query.